This page covers the supplementary information of the article:
Oscar Flores and Modesto Orozco (2011). nucleR: a package for non-parametric nucleosome positioning. Bioinformatics 2011, doi:10.1093/bioinformatics/btr345
Experimental dataset
For evaluation purposes, we used a nucleosome map obtained from a NGS experiment performed in our group[1]. In the nucleosomal DNA preparation, exponentially growing yeast cells were first cross-linked with formaldehyde, spheroplasted with zymolase and finally subjected to a MNase partial digestion to generate core nucleosomes containing DNA fragments of around 147 bp. Cleaved DNA sample was sequenced on the Illumina/Solexa Genome Analyzer (GA) IIx to generate paired-end reads. Data was processed with standard GA base calling pipeline to convert initial raw images into sequences. The short reads were mapped to S.cerevisiae 2003 genome[2] with Bowtie software[3], allowing up to 2 mismatches and discarding those reads mapping in multiple loci. The data was imported into R software and preprocessed using the HtSeqTools[4] package. Resulting reads where processed by nucleR as described in the main text. For further details about the experimental protocol or preprocessment steps see reference [1]. The coverage maps used in the benchmark section is available for download here (RData format, 11Mb)
Strand correction for single ended sequencing reads
In single ended sequencing only one end of the DNA fragment is available, mapping only in one strand. This makes the reads mapped on the positive strand being shifted respect those from the same fragment on the negative strand. In the preprocessment of the NGS reads, nucleR corrects this bias by shifting both strands downstream to overlap reads from both strands, avoiding fake coverage peaks and remarking the nucleosome dyad position. In order to apply this shift, an assumption over the average fragment length is needed. nucleR provides an automatic detection of the fragment length based on the calculation of the optimal shift which gives the best agreement between coverage peaks on both strands. If the user already knows the average length of his/her fragments (from sequencing report, gel electrophoresis, assuming 147bp nucleosome length, etc.) a fixed value can be provided accelerating the preprocessment step. Detailed information about the preprocessment and automatic fragment length detection is available inside man page of R functions processReads() and fragmentLenDetect() respectively.
Fast Fourier Transform implementation and peak calling
nucleR transforms the coverage profile to the Fourier Space and knocks-out the noisy components of the signal before performing the inverse transform. This is done by an efficient method of Fourier Transform called Fast Fourier Transform (FFT)[5]. FFT works best with power of 2 length signals, and can be extremely inefficient if the profile has a length coinciding with a prime number (not factorizable)[5]. In order to work efficiently with extremely large datasets, our FFT implementation presents some tweaks to dramatically increase the performance, requiring seconds of processing instead of days in worst cases. These tweaks include:
- Filtering by regions, instead of the whole chromosome at once. This is performed isolating the covered regions by splitting the genome on large uncovered (or unavailable) sites.
- Splitting the large rows of values into fixed-length, power of 2, vectors, allowing a overlapped window before the chunk i and i+1 to allow convergence of the filtered signal.
- Padding 0 values at the end of a given chunk to enlarge it till nearest power of 2. Added values have tiny impact on the filtered profile and are removed after transformation.
These tweaks have no impact in the obtained results, being the correlation between the native FFT results and ours very close or equal to 1.
Once the signal is clean, the peak calling can be performed by a simple trend changing detection method over the nucleosome coverage value, i.e., we detect a peak in the position pi if value(pi) > value(pi+1). In tiling arrays, the nucleosome coverage is given by a positive hybridization fluorescence ratio, and in sequencing is calculated by a certain amount of reads piled in a single region. In both cases, a nucleosome will appear as a positive peak in the global landscape.
Due to the larger amount of noise in Tiling Array experiments, we recommend 1% of the components in TA and a 2% in NGS. Thanks to the initial format conversion, this is the only difference in the processing of data from both technologies. The percentage of components selected for knock-out is justified by visual inspection of the power spectrum. See Figure S2 for further information.
The Fast Fourier Transform filter is applied instead of a regular running average because it filters the signal removing the noise instead of just smoothing it. Running averages would need a large window for obtaining smooth data profiles, affecting the shape and the positioning of the peaks in the process. See Figure S3 for an example.
Benchmark
We compared nucleR performance with the two main approaches used in nucleosome calling from high-throughtput experiments: a Hidden Markov Model (HMM) based on Lee et al.[6] and a peak detection based nucleosome caller package available on R/Bioconductor repository, ChIPseqR[7].
nucleR method can be applied in both TA and NGS due the normalization of input data, but the other methods are specific for a single technology, so a three-way comparison with a single dataset is not possible.
To provide objective results about the performance of these alternatives, we used two different approaches: measure the reconstruction of the original map from detected nucleosome calls and the detection of nucleosomes in a synthetic map generated with nucleR
Reconstructing maps from calls
In order to evaluate the accuracy of the nucleosome calls in the 3 compared methods with real data, we performed a full nucleosome detection using genome wide maps and then we measured the correlation between the nucleosome coverage created from the calls and the original map.
We used the dataset and the nucleosome calls provided by Lee et al.[6] when evaluating the performance in Tiling Array experiments where a Hidden Markov Model was applied and a High-Throughtput Sequencing experiment performed in our group when evaluating the peak detection algorithm (ChIPseqR[7]).
In both cases the raw data was preprocessed and imported into R where we applied the steps described in the main text to perform nucleosome detection. In the case of ChIPseqR the calls were calculated applying the pickPeak() function in the coverage profile with the same threshold as nucleR (percentile 20 of the coverage).
As the nucleosome calls provided by Lee and colleagues are classified in well-positioned and fuzzy nucleosomes, we translated that to 5 phased nucleosome reads for each well-positioned and a region with a mean coverage of 2 reads for fuzzy nucleosomes. The peaks detected by nucleR and ChIPseqR were converted directly to one nucleosome read with the dyad centered on the detected position. These reconstructed reads were created using IRanges library in R and the reconstructed coverage calculated with the associated coverage() function.
The Pearson's correlation between the smoothed Tiling Array hybridization profile and results from the HMM was 0.38, while the same profile shown a correlation of 0.63 with the reconstructed map from nucleR calls.
For the NGS experiment, the correlation of the reconstructed and the original coverage map was 0.03 for ChIPseqR and 0.29 for nucleR.
Synthetic maps
We implemented in nucleR package the function syntheticNucMap() which allows the creation of synthetic coverage or enrichment ratio profiles. The details of the function and the description of the parameters are in the corresponding R manual page. Below there is described a summary of the process:
- Well positioned nucleosomes are placed periodically leaving some bases of linker DNA between them. The number and the width of nucleosomes as the length of linker DNA segments can be arbitrarily set by the user.
- A ceirtain number of fuzzy nucleosomes is added randomly on top of the well-positioned ones.
- For each nucleosome read (well-positioned and fuzzy), a random number of repetitions are created slightly shifted respect the "canonical" position, following the constrains of the user.
- Additionally, a random map of reads can be created to simulate a naked DNA sample and consequently calculate the ratio between the nucleosome and the random map.
By creating this synthetic map the user is able to know exactly the positions of the original nucleosomes, accounting with "perfect information" that allows the performance test of the different methods. An example synthetic map is shown in Figure S4
We created a synthetic map using the following call:
syntheticNucMap(wp.num=1000, fuz.num=200, wp.del=50,
as.ratio=TRUE, rnd.seed=1)
This call generates a map with 1150 nucleosomes (950 well-positioned and 200 fuzzy) with an associated ratio profile. The internal R random seed is set to "1" to allow reproduction of the results.
Using this map, we computed the nucleosome calls using a HMM based on Lee et al., ChIPseqR and nucleR. As mentioned previously, HMM expects enrichment ratio values and ChIPseqR expects raw coverage values. To make a fair comparison, we calculated the nucleosome calls using nucleR in both contexts.
The following table summarizes the hit percentage (how many nucleosomes where detected) and the mean deviation between the predicted and the real dyad:
| % hits | deviation (bp) | |
|---|---|---|
| nucleR(cover) | 95.22 | 2.12 |
| ChIPseqR | 81.82 | 2.24 |
| % hits | deviation (bp) | |
|---|---|---|
| nucleR(ratio) | 77.22 | 13.24 |
| HMM | 67.13 | 26.27 |
Supplementary Figures
a)
 b)
b)
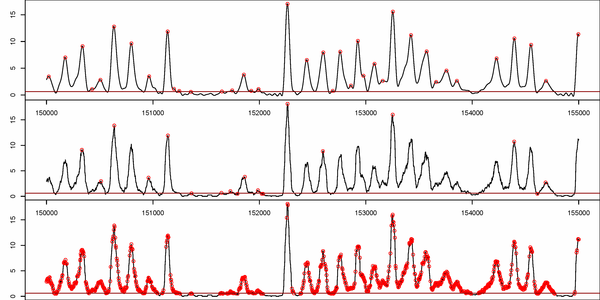
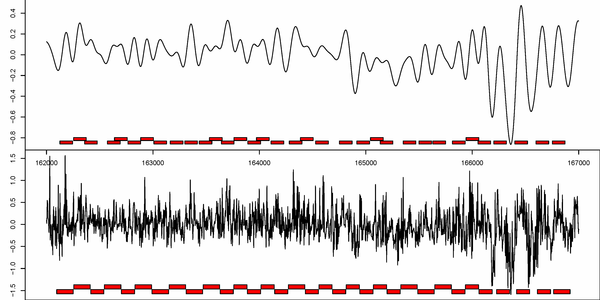
Figure S1. Comparison between presented nucleosome calling methods. a) nucleR calls over filtered TA profile (top) versus Lee et al. Hidden Markov Model (HMM) calls over raw TA profile (bottom). b) nucleR peak detection (red dots) over filtered NGS profile (top) versus ChipSeqR results over raw NGS profile, using default parameters for global maximum (middle) and local maximum (bottom) detection. Used threshold (percentile 25 of the sample) appears as a dark red line in the bottom of each track.
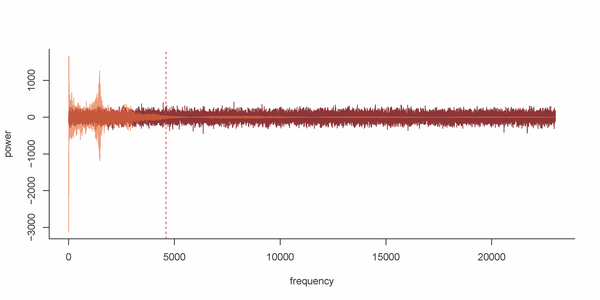
Figure S2. Power spectrum of nucleosomal DNA sample sequenced by NGS (orange) versus a random profile (red). Components at left of dashed red line (percentile 2 of total components) will be the ones saved from the knock-out.
a)  b)
b) 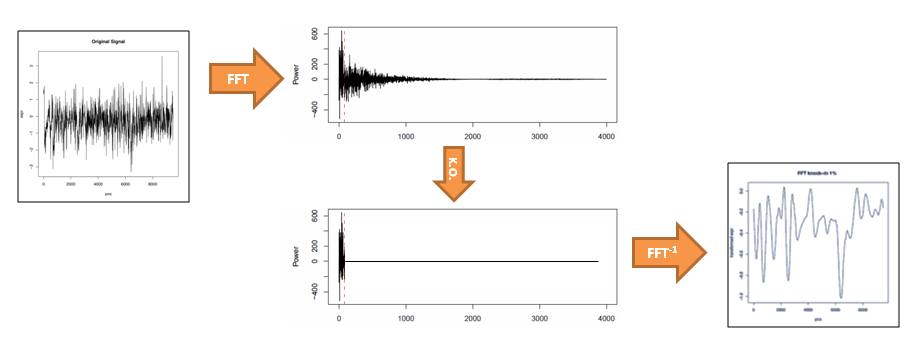
Figure S3. Effect of FFT filtering. a) Normal running average smoothing with windows of different length (from left to right: raw data, 25, 50 and 100bp average window). Noise is always present, despite smoothed. b) Outline of the filtering process. From raw data the FFT is applied and the components over the marked 1% percentile (red dashed line) are knocked-out setting them to zero. The inverse FFT is applied to obtain the noiseless profile.
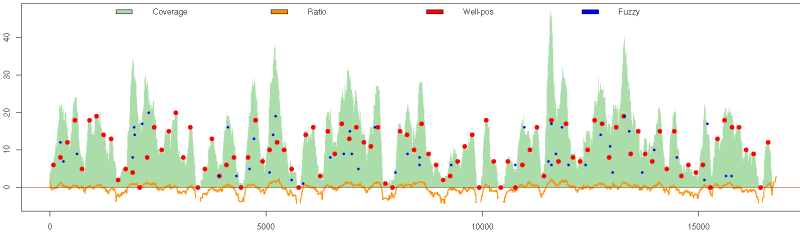
Figure S4. Synthetic nucleosome map generated with nucleR. The coverage profile (green) is calculated from the reads of well positioned (red) and fuzzy nucleosome (blue) (nucleosome dyads represented as dots). The ratio between this coverage and a random sample is represented in bottom (orange).
References
1. Deniz, O. et al. (2011) Physical properties of naked DNA influence nucleosome positioning and correlate with transcription start and termination sites in yeast. BMC genomics
2. Downloaded from: ftp://genome-ftp.stanford.edu/pub/yeast/data_download
3. Langmead,B. et al. (2009) Ultrafast and memory-efficient alignment of short DNA sequences to the human genome. Genome biology
4. Planet, E. et al. (2011) htSeqTools: High-Throughput Sequencing Quality Control, Processing and Visualization in R. Bioinformatics
5. Smith,S.W. (1999) The Scientist and Engineer’s Guide to Digital Signal Processing (Second ed.) California Technical Publishing. Available online: http://www.dspguide.com/ 6. Lee,W. et al. (2007) A high-resolution atlas of nucleosome occupancy in yeast. Nature genetics 7. Humburg, P. (2010) ChIPseqR: Identifying Protein Binding Sites in High-Throughput Sequencing Data. R package version 1.4.0. Available online